
In every role I've held, the technology cost forecast got the same reception. People nodded, filed it, and went back to making decisions without it. When it missed, there was always a reason: the migration slipped, the launch came early, the contract renewed at a different price, AI usage doubled. Nobody was surprised, because nobody was really using it. The forecast had become a formality.
Now there's data behind the nodding. In the 2026 FP&A Trends Survey, confidence in forecasts beyond six months fell from 39% to 29% in one year. Only 19% of FP&A teams can run a scenario in real time or within a day.
That's a problem because technology spend no longer waits for the planning cycle. Cloud, SaaS, and AI costs move with usage every day, and more of that usage comes from agents calling models and spinning up resources on their own. The forecast should be what you check before you approve the migration, sign the renewal, or roll out the agent. Instead, it's last quarter's spreadsheet.
To be useful, a technology forecast must be accurate, cover all technology costs, stay current as the business changes, and reach the decision-makers. Until recently, getting all four was hard.
Why better forecasting is now within reach
Three things have changed in how organizations collect, forecast, and consume technology cost data.
A common language for cost data. With FOCUS, organizations can normalize cloud, SaaS, AI provider, and other technology costs into one structure and forecast them together, instead of one provider or category at a time. Standardized data is also easier to enrich with business context: applications, teams, products, and projects connect to cost and usage once, without a different approach for each provider's data model. You can then analyze the forecast at the business constructs where stakeholders actually make decisions.
Better forecasting models. A few years ago, a widely cited paper showed a simple linear model beating the transformer architectures of the time on standard forecasting benchmarks. The field responded by combining the two. Hybrid approaches let classical statistics handle trend and seasonality, while machine learning captures the non-linear patterns and sudden shifts statistical models miss. Time-series foundation models, pretrained on large, varied collections of time series, produce usable forecasts on data they haven't seen, without tuning a model for each series. That makes it practical to forecast thousands of granular series, each account, service, or application, rather than one aggregate. Newer models also take in known future inputs, such as planned events, and return a range with stated confidence instead of a single line.
Access through AI. Teams no longer need to understand provider-specific cost semantics or build a separate integration for each dataset. With AI on top, users can explore a forecast and the signals behind it in natural language, investigating trends, assumptions, and cost drivers without touching the underlying data structures. The same data supports agentic workflows too.
These advances make better forecasting possible. The harder part is knowing what will happen next and translating it into financial impact.
Forecasting what hasn't happened yet
Historical data only tells part of the story. Technology costs are shaped by events that may not exist in the history at all: a product launch, a migration, a new region, an acquisition, a contract change, a step change in AI consumption. History also holds one-off events, like a migration or an unusual consumption spike, that shouldn't be projected forward.
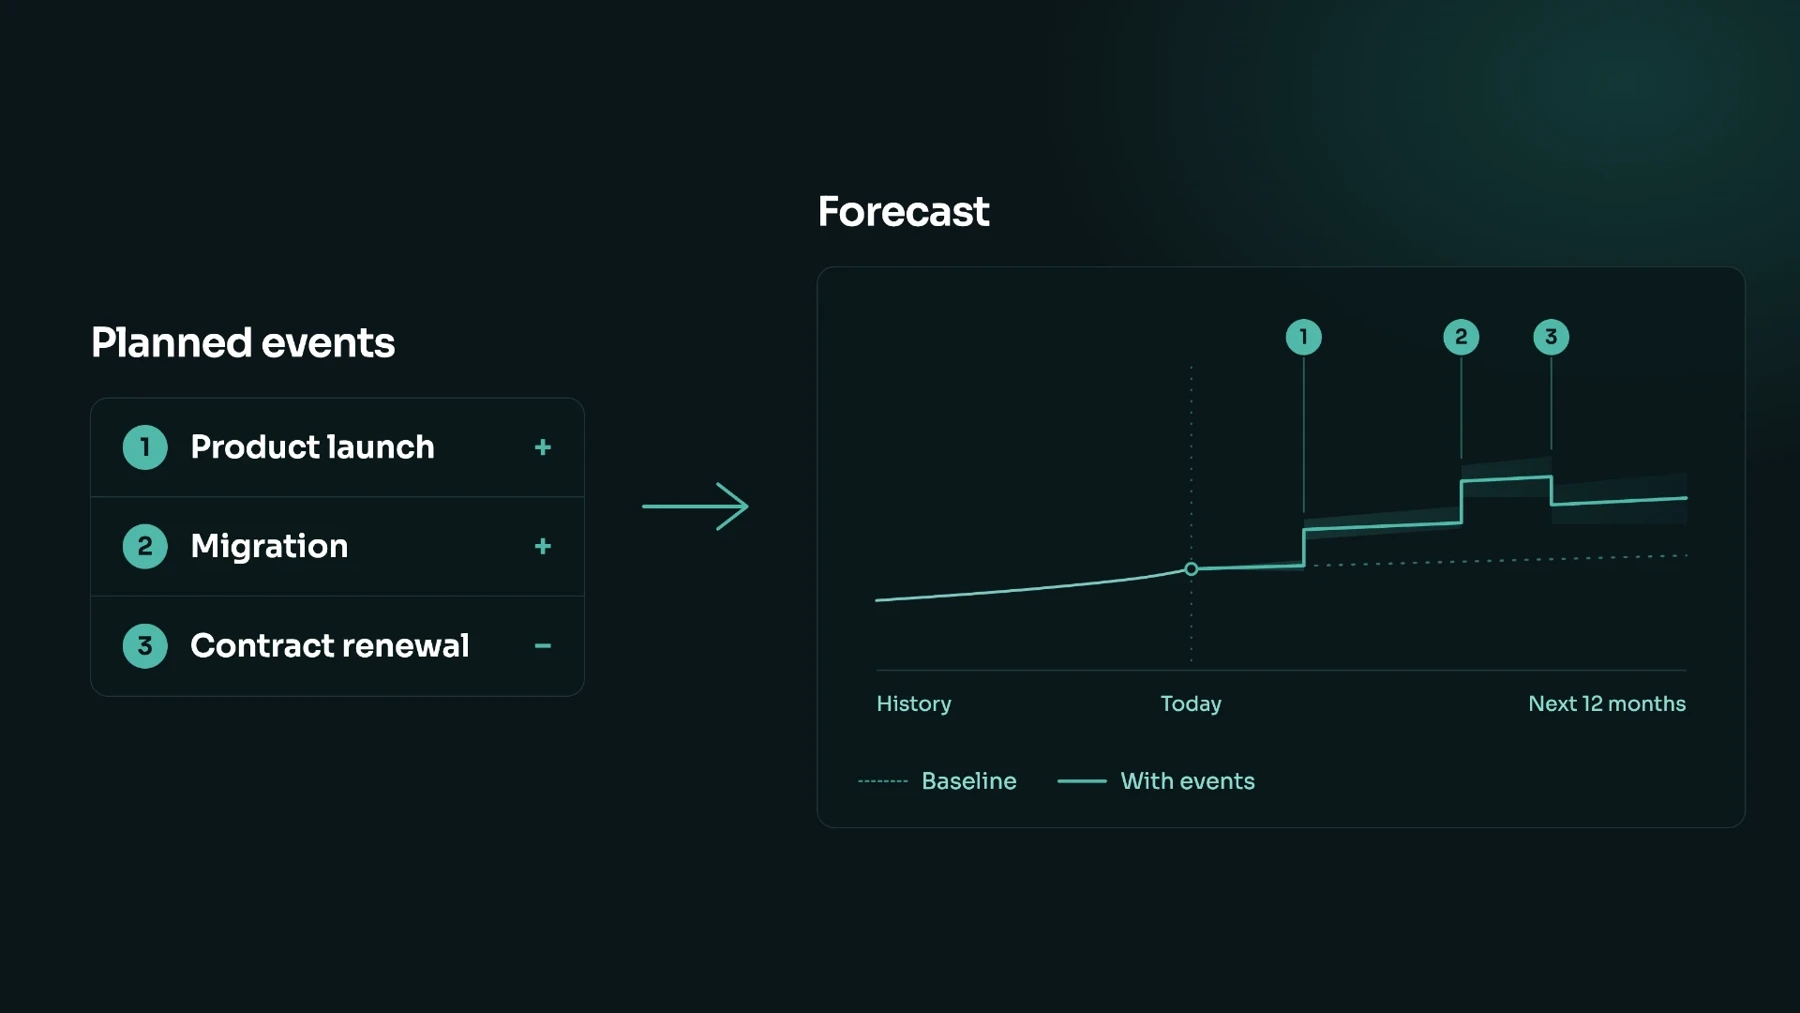
A useful forecast combines historical signals with what the organization knows is coming. Each event has to be translated into its cost implications. For example, a product launch may affect expected customers and transactions, the applications involved, infrastructure, data volumes, AI consumption, SaaS licenses, and vendor commitments. Some impacts are direct; others depend on relationships elsewhere in the estate. Connecting the event to the costs it touches requires a cost model with enough granularity and business context, something a spreadsheet assumption cell doesn't provide.
Events also don't arrive one at a time. A launch, a migration planned by Technology, and a contract renegotiation managed by Procurement may all land on the same cost base. Teams need to configure each event, change its assumptions, stack it with the others, and see how the combined forecast differs from the baseline. Anomalies need the same treatment in reverse: remove or adjust them so they don't distort the outlook.
A forecast built this way lets Finance and Technology evaluate decisions before costs appear on the bills: what happens if an assumption changes, how two alternatives compare, which events drive the change in the outlook. It stops being a number prepared for the planning cycle and becomes a shared view of where technology costs are going, and why.
How StitcherAI approaches forecasting
StitcherAI forecasts from the cost model itself.
Granular data with cost semantics. Cloud, SaaS, AI, vendor, and other cost and usage data are normalized into a common FOCUS-based structure and enriched with business context. Forecasting works from that detail rather than a monthly total, and accounts for the economics of technology cost: commitments, discounts, pricing structures, taxes, prepayments, burn-downs, and cash or accrual treatment. The forecast reflects how spend is billed and recognized, not only how it has trended.
Current forecasting techniques. StitcherAI builds on the advances above, combining statistical methods with modern machine learning and foundation models across the cost model's detailed series to capture patterns and correlations where they occur.
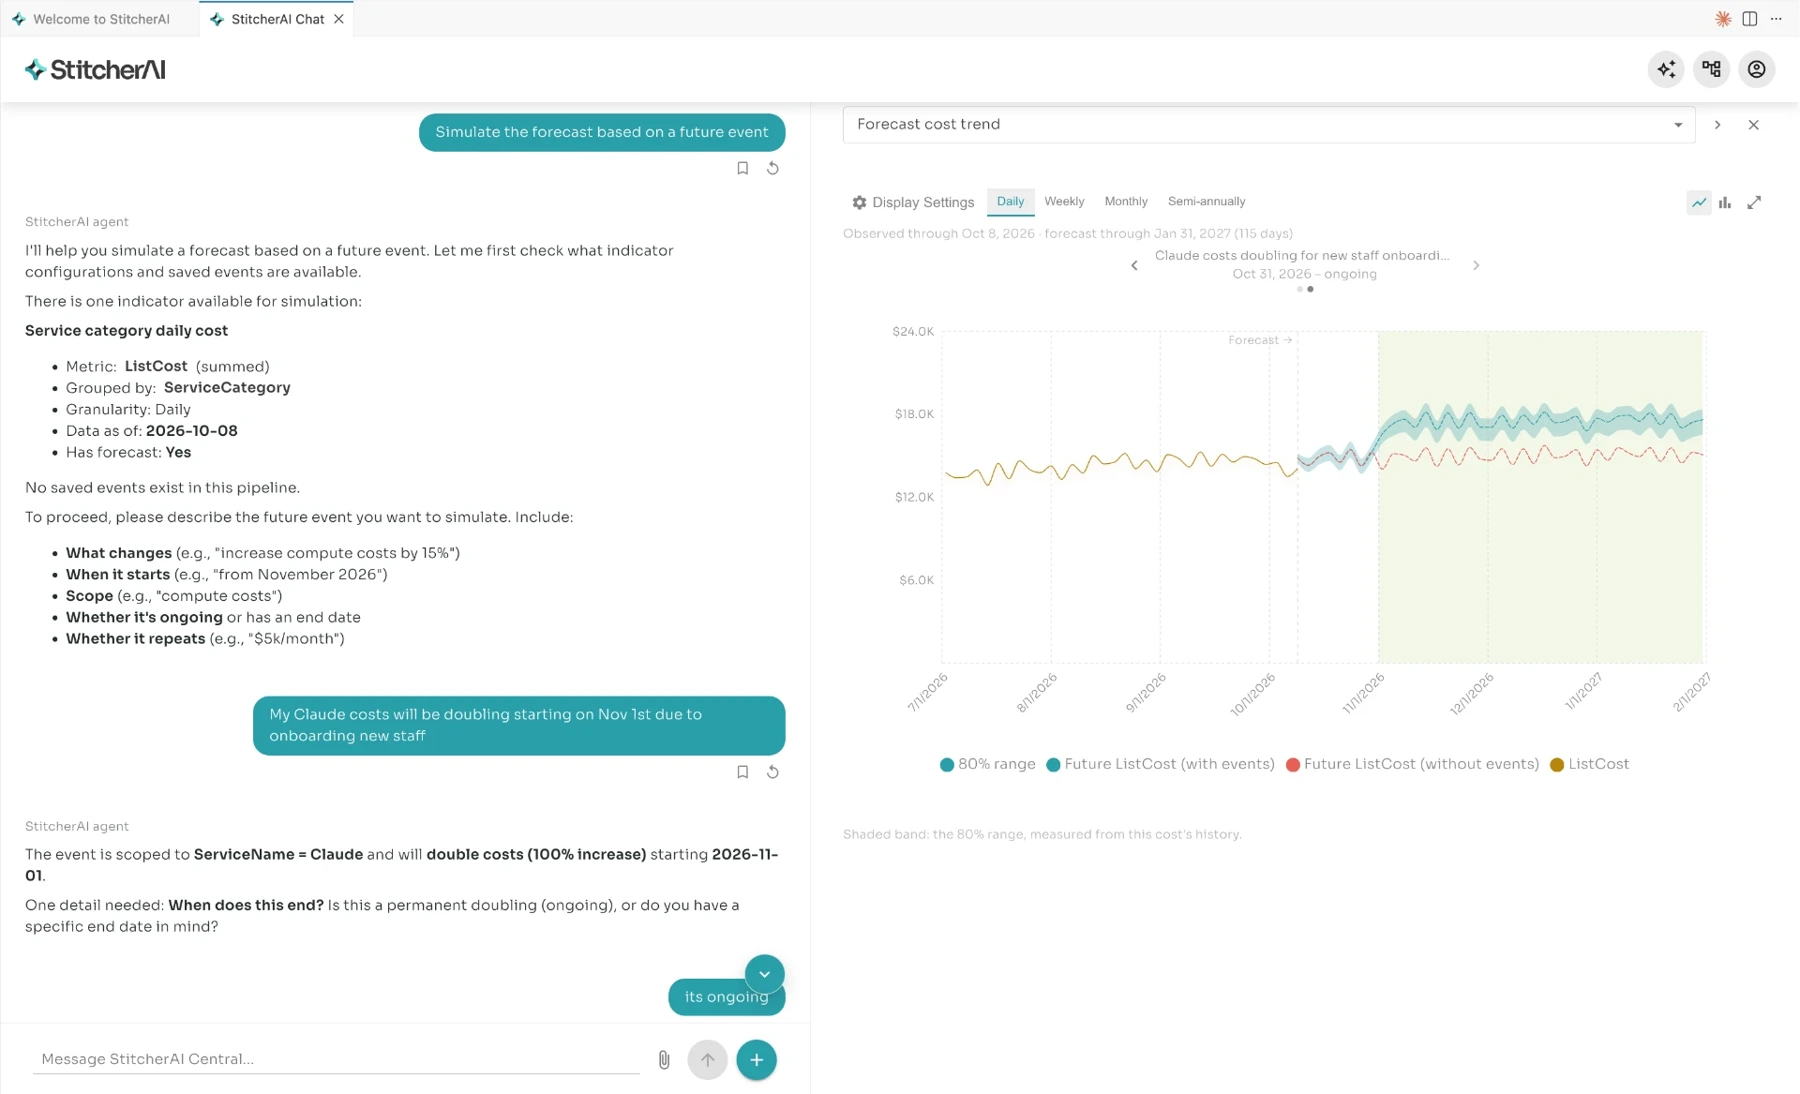
Events and anomalies in natural language. Describe an event in plain language, such as "we launch in Germany in Q2 and expect 40,000 new customers in the first year", and StitcherAI represents its assumptions and expected impact in the cost model. Change its parameters, stack it with other events, and compare the result with the baseline. One-off anomalies in the history can be removed or adjusted the same way.
Current and versioned. The cost model updates as new cost, usage, and business information arrives, so forecasts refresh as the picture changes instead of being rebuilt each planning cycle. Every version is kept, just as Finance as Code versions the model, so you can see which new data or changed assumption moved the forecast.
Open to people and agents. Finance, Technology, and business stakeholders can explore the forecast, its assumptions, and its cost drivers in natural language, and agents can use the same model to test scenarios and surface what changed. Because the forecast stays connected to the model, anyone can move from a forecasted number to the assumptions behind it.
Bill to business
The journey starts with the bill. Bring cost data together, model it in the context of the business, and use it to understand what happens next, with future events and changing assumptions built into the model and the forecast kept current as the estate changes.
What sets this apart is a forecast connected all the way down: from the number, to the events and assumptions that produced it, to the cost and usage data underneath. That is what lets people stop nodding at the forecast and start using it to make decisions throughout the year.
Interested in seeing what a forecast like this looks like against your own estate? Let's talk!